Hey All, so I posted an article on setting up your own Linux based firewall using iptables, and thought it would be nice to be able to monitor the connections coming in and out of each interface on the Linux Firewall. So I installed and played with two passive Network Traffic Monitoring applications; nTop and darkstat.
All in all they are both very good at what they do, record network traffic/connection information, and display it in a pretty graph.
nTop
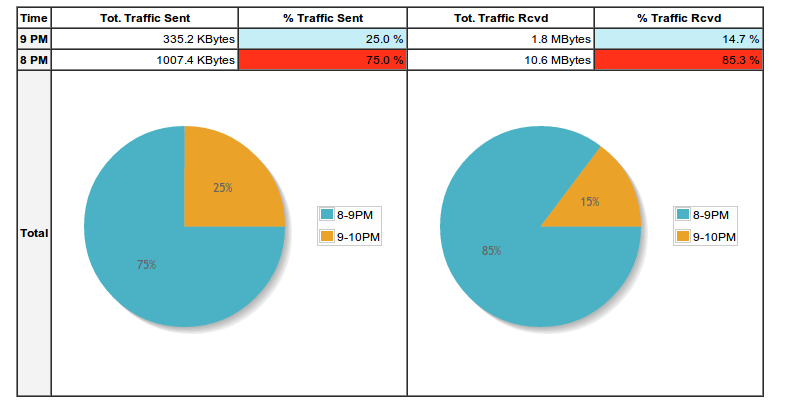
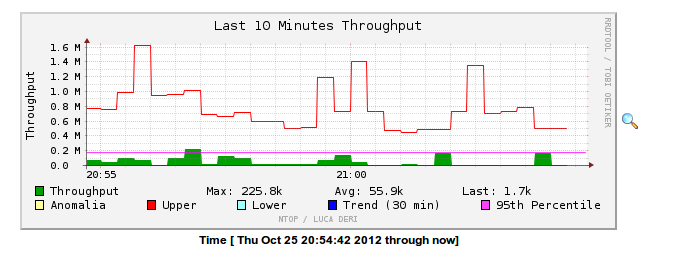
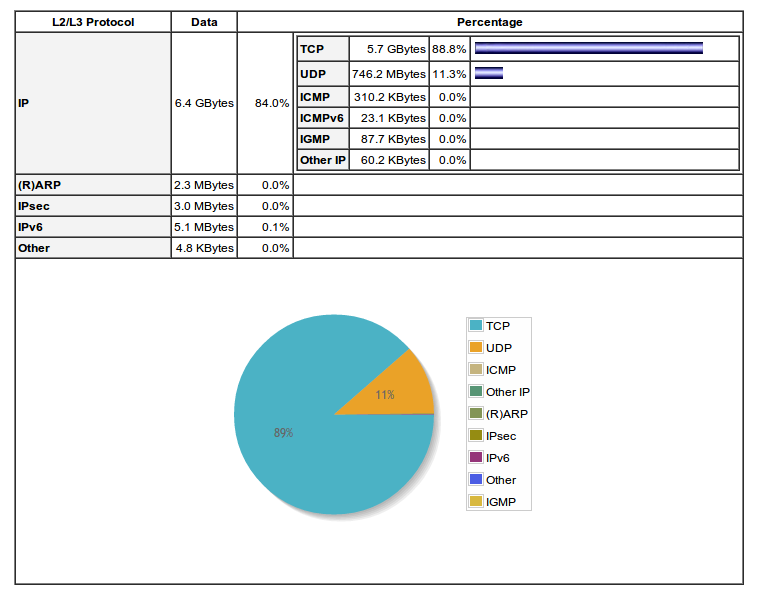
nTop obtains and maintains a very large amount of data, everything from my simple IPs in a connection, to an itemized list and distribution of the protocols being used by each IP. nTop comes complete with pie graphs and line charts to show the IP connection usage over time, and is very customizable. You can select the single network interface or multiple. Hooray! You may also setup a custom user table to allow restricted viewing of the information nTop collects. Last, nTop utilizies the RRDTool mechansium for display the information collect which is great, especially i you have ever used cacti before.
Cool Features:
- Custom Labels — Ability to create custom labels for each device seen by nTop.
- Application Protocol Dissection — nTop can decode many common protocols for each connection stream and display statistical information about them. Including HTTP, HTTPS, FTP, etc.
- Trending — nTop keeps track of each network connection, reporting on when connection are initiated, how often, by who (IP), etc.
- In-depth Detail — The in-depth detail nTop gives you is very beneficial for a complicated setup. For example, the Linux Firewall we created had 3 networks attached to 3 different interfaces on the Linux box. nTop makes it easy to summarize the traffic from all 3-legs via it’s (dun, dun, dun) Summary page. Displaying a snapshot of recent traffic and it’s trends.
Not So Cool Features:
- Dependencies — nTop relies heavily on other application dependicies, such as libpcap, RRD, etc. Thus increasing it’s complexity.
- Incomplete documentation — it may have been just me, but when I was setting up nTop I had to search Google a lot to figure out many steps along the installation.
- Prepacked vs SVN — The prepacked .deb file Ubuntu has is an old version. SVN, obviously is the the latest and greatest, so see below for an installation walk-through.
- Too much? — nTop may be too much for what you need. It is not a simplistic Network Traffic Monitor, this may bet too much for those just looking to display a few things about their network traffic.
Screens:

Installing nTop on Ubuntu 12.04 or Debian
- Install dependencies.
sudo apt-get install libpcap-dev libgdbm-dev libevent-dev librrd-dev python-dev libgeoip-dev automake libtool subversion
Or
sudo apt-get build-dep ntop
NOTICE: I am install nTop from the latest stable source, I did previously install it from the Ubuntu Package system. However, it was an older version.
- Download the stable source tar.gz from ntop, here. And decompress it.
tar xzvf {ntopversion}.tar.gz - Rather than initiating a ./configure run the autogen.sh file instead which will automatically create the proper make files.
./autogen.sh
- Do a make, then make install
make
sudo make install
- If you try to run nTop, it will complain that it cannot find some files, for example, libntopreport-5.0.1.so. To remedy this, copy everything relating to nTop from the /usr/local/lib/ location to the /usr/lib/ location.
sudo cp /usr/local/lib/libntop* /usr/lib/
This will copy the necessary files nTop is complaining about, you could also just as well created a symlink or something else. (see links, here, here, and here.)
- Create a DB folder where nTop can save it’s database files to, also give this directory nTop user ownership.
mkdir /home/{user}/nTopDB
sudo chown ntop. nTopDB
NOTICE: This step is not necessary, I only did it so I would remember where nTop was putting all it’s DB information files and RRDTOol files.
- Now start up nTop with the correct parameters. For this example I have an eth0, eth1, and eth2 interface.
sudo ntop -i "eth0,tun0,eth1,eth2" -d -L -u ntop --skip-version-check --use-syslog=daemon -P /home/{user}/ntopDB/ --set-admin-password={your_admin_password}
-i = interfaces
-d= run as daemon
-L = use syslog facility
-u = run as user “nTop”
–skip-version-check = self explanatory
–use-syslog=daemon = use current syslog daemon to handle application logging
–set-admin-password = sets te Admin web password, very important!! - I recommend taking the command from above and putting it into a shell script file or text file, so you don’t forget the parameters used when starting nTop.
vi start_nTop.sh bash sudo ntop -i "eth0,tun0,eth1,eth2" -d -L -u ntop --skip-version-check --use-syslog=daemon -P /home/{user}/ntopDB/ --set-admin-password={your_admin_password} - If all goes well you should see something like this:
Fri Oct 26 14:20:52 2012 Initializing gdbm databases - Check out syslog to verify no errors where thrown upon nTop execution. less /var/log/syslog.
darkstat
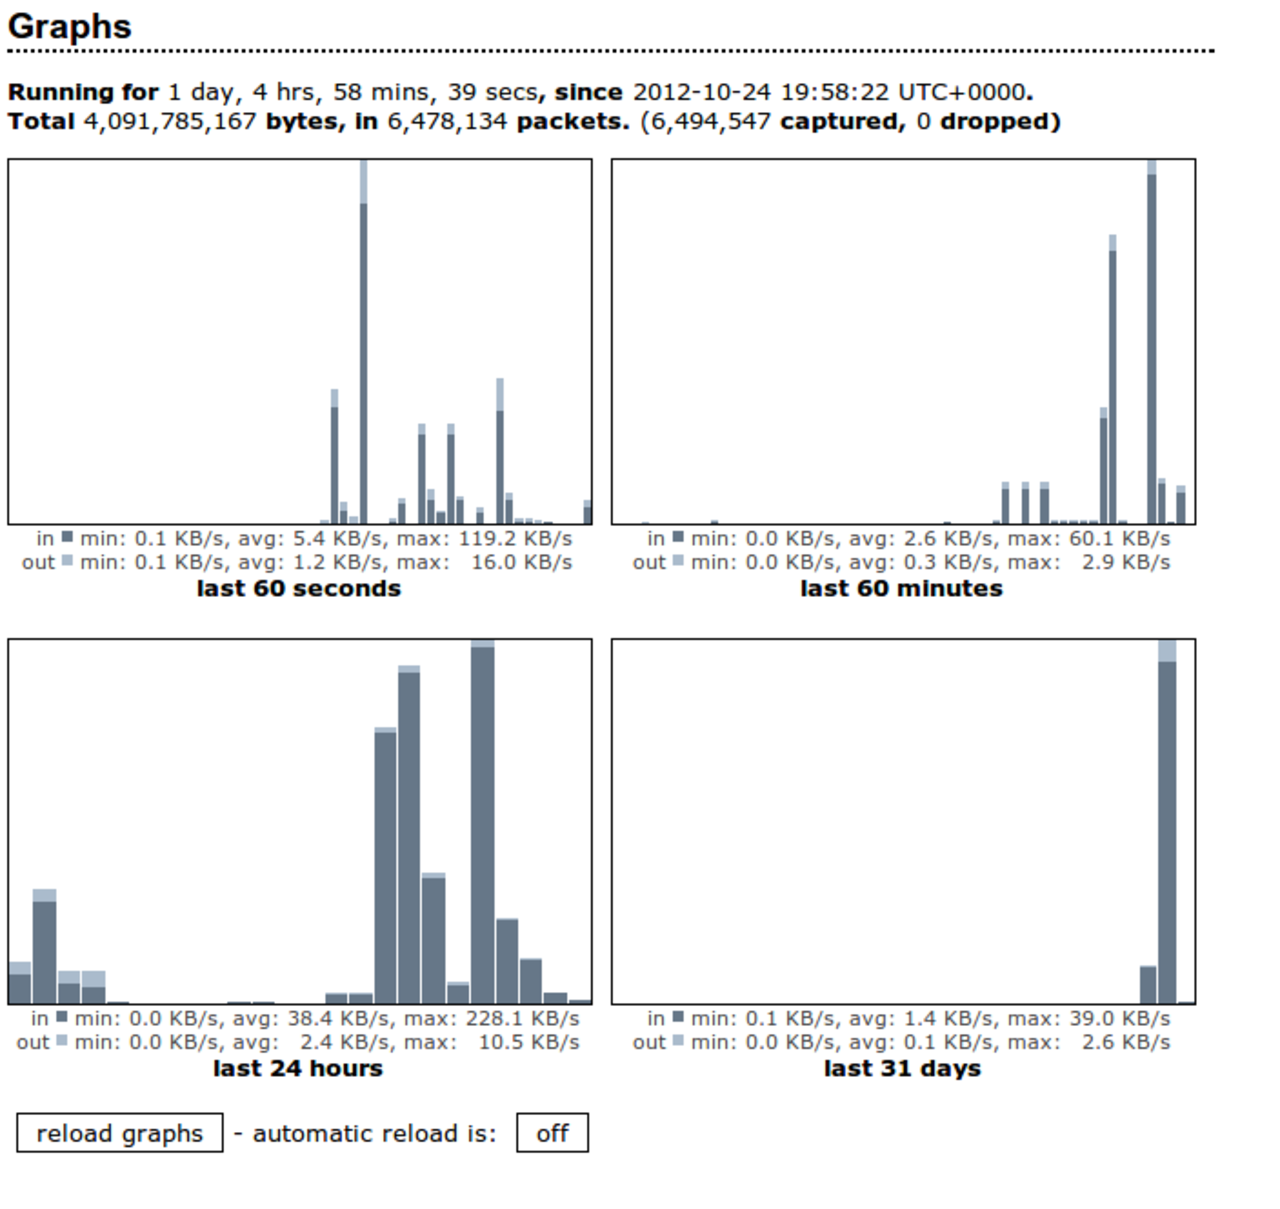
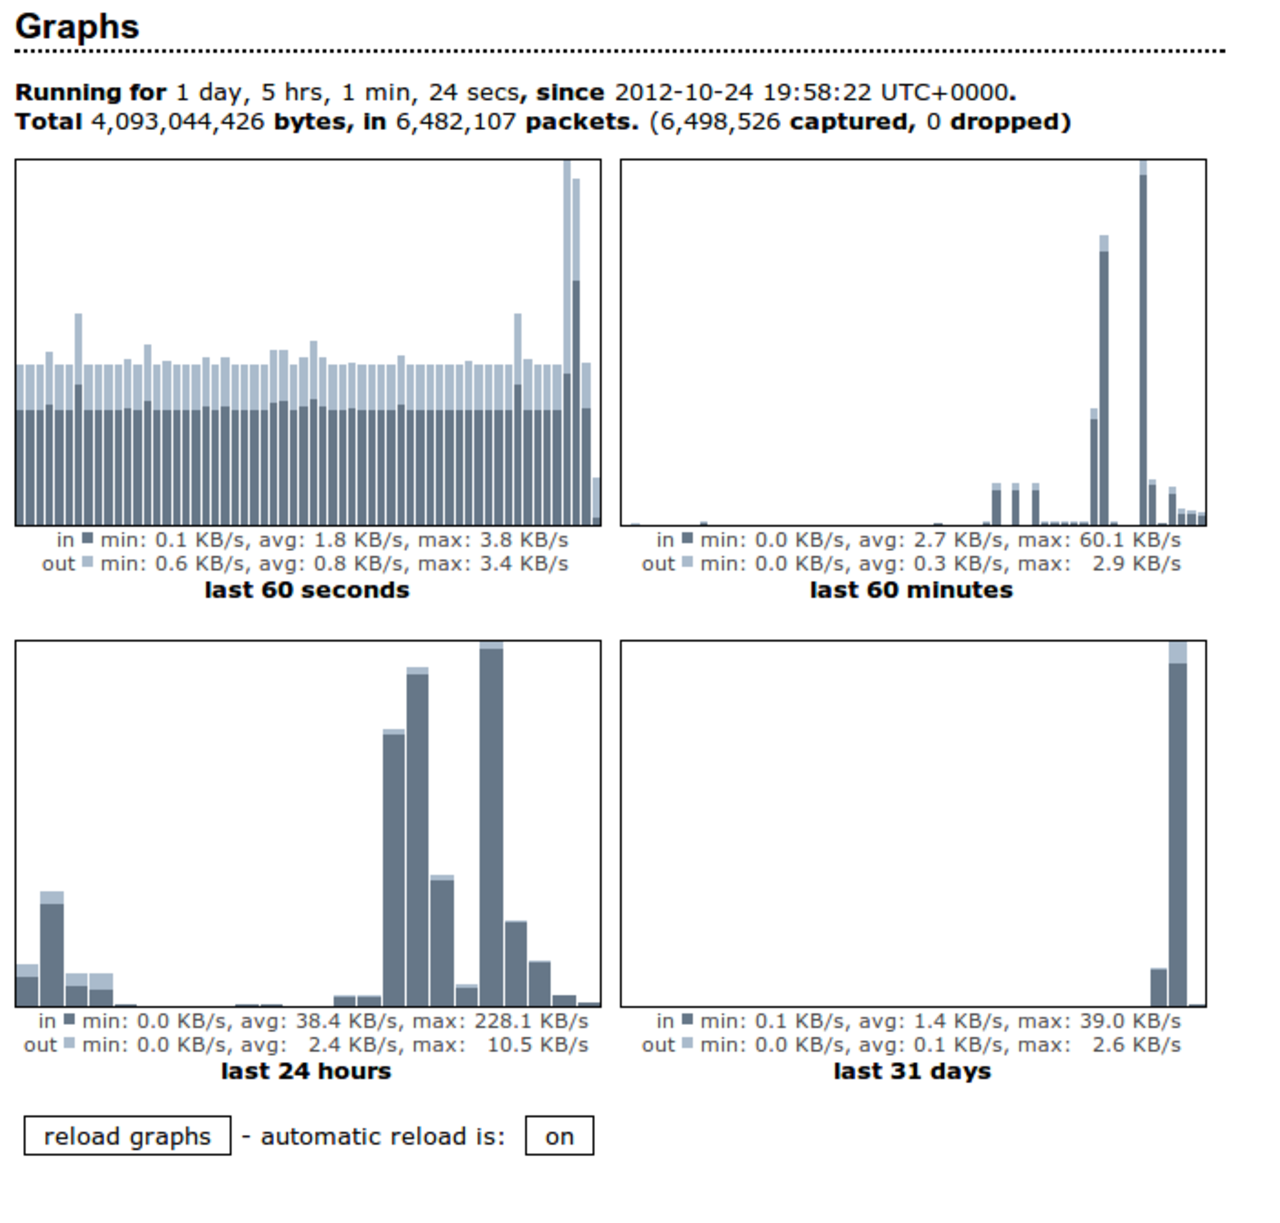
I stumbled across darkstat while Googling for a “network traffic web reporter”. Sure enough darkstat does exactly that. darkstat gives the user a simplistic web based report of the current network connections running, as well as, network traffic trends displayed in graphs and charts. darkstat also provides a super easy installation and setup to get you going right away. I can’t stress it’s easy installation enough, it was only 3 steps!
Cool Stuff:
- Easy Install — Super easy install, see below, only 3 steps to get you going with monitoring network traffic.
- Moderate Detail — Providing a moderate amount of detail, which should be plenty for those looking for strictly a network connection monitor that has a few graphs and charts.
- Last 60 seconds Graph — This graph is pretty cool, especially if you have auto-refresh on. It shows real-time throughput over the last 60 seconds and is updated frequently. Giving you a good idea of what the current network demand is.
Not So Cool Stuff:
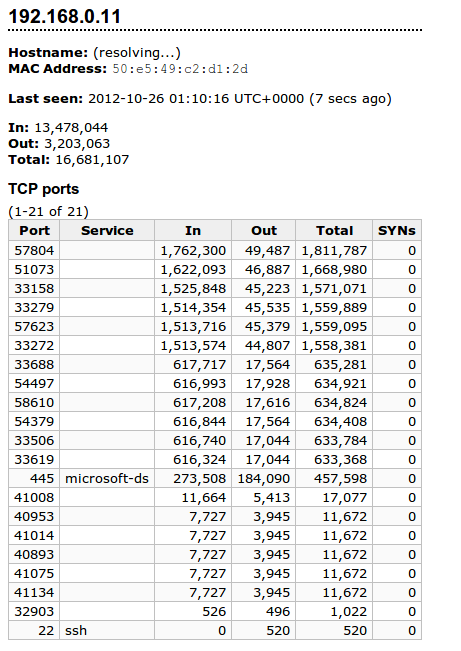
- Too simple — May be too simple for your network monitor needs. Only, lists IP addresses, and when they were last seen. Graphs contain only rudimentary information.
- No Packet Details — Lacks the packet inspection aspect that nTop has. Such as, protocol distribution, demand, frequency, etc.
Screens:
Installing darkstat on Ubuntu 12.04 or Debian
- Install from Ubuntu’s or Debian’s package system.
sudo apt-get install darkstat
- Modify the init.cfg file for this application located /etc.darkstat/init.cfg. Add these lines, or uncomment them.
sudo vi /etc/darkstat/init.cfg
START_DARKSTAT=yes
INTERFACE="-i eth0"
PORT="-p 8081"
BINDIP="-b 192.168.0.1"
LOCAL="-l 192.168.0.0/255.255.255.0"
DNS="--no-dns"
Most of these are obvious. A few things to note. INTERFACES can only contain one interface :(. PORT, default is 666, I changed it to 8081. BINDIP, I had to expicilty set this to the IP of the Linux box, 127.0.0.1 would not work for some reason.
- Start it up:
sudo service darkstat start
That’s It!, I hope you found this article useful. I urge you to try both out yourself before committing to one or the other.
Cheers!
Sources:

I was unable to get ntop to work with the “-P /home/{user}/ntopDB/ ” portion of the command. The file permissions were all correct, but it complained about not being able to open a prefs.db file. Removing it allowed the program to start and collect data.
darkstat was a PITA. There’s a bug in the current release that foobars if you don’t have ipv6 capability loaded into the kernel (add ipv6 to the end of /etc/modules and reboot.) It tries to start but complains about protocols. This happens regardless if you use, or even have the capacity to use ipv6.
Even after adding ipv6 to the system, I was unable to get it to provide any data via the internal webserver.
The default port is 666. When I left it alone, I was able to access the internal webserver from port 667.